Friday, April 30, 2010

Quick Note on our BPOP Jul $3 Call Option


Just wanted to post a quick note on BPOP. We entered BPOP jul 3 calls a couple weeks ago @ .30. We have shaved some of the position as it has pushed up in our favor. The daily chart has a nice Bull Flag type pattern and our position is currently trading at 1.20.

I just wanted to point out that the FDIC seized 3 banks in Puerto Rico today. We got into this position on a technical setup and after I noticed massive bullish action being taken via the purchase of Call options. It is offensive sometimes to see how certain people and institutions have access to certain information before the common everyday individual does.

Here is a link to a recent article,
http://finance.yahoo.com/news/Popular-Inc-Assumes-Deposits-bw-1801126839.html?x=0&.v=1

I will continue to hold the position as I think it should see $5 in very short order.

I will continue with my daily posts when I get back next week.

Have a great weekend.

Wednesday, April 28, 2010

Quick Note on Gold Stocks

Hi guys, just wanted to post a quick note. I had SA trigger long for me on Monday. Yesterday I had GG, IAG, CDE and AUY trigger long, even in the face of the dollar strength. I have brought my stops up on all of these names and will continue to do so as they move, I ultimately have a longer term bullish outlook in Gold and think we can take out the highs in the next 6 to 12 months.

Will try to post as much as I can being away and all, but will be back next week to full time

Tuesday, April 27, 2010

GOOG Offering a Low Risk Entry

Hey guys, I will be away most of the week but just wanted to point out GOOG, it is at a great support area here offering us a low risk entry. $530 looks to be a good entry with a stop at $526.00

Monday, April 26, 2010

OXY May 90 Call Update

Most of you guys who took this trade with me know I got stopped out on 4/19 for a loss. I continued to stalk it as it held the uptrend line and re-entered the position on Friday 4/23 @ .88. I know some of you guys took the trade with me on Friday and we did shave some of the position off later on that day @ 1.40. I have now brought my stops up to 1.05. I think Oil might continue to get a lift. After the impressive sessions on Thursday and Friday crude managed to fight its way back after selling off pretty hard during the day especially on Thursday. Keep an eye on the Dollar and look for Crude to hold the $84 to $83 level. If those levels give out tighten up those stops on the energy trades. For now I am looking for Crude to re-test the 4/6/10 highs of $87.10 and then $89. Keep in mind OXY reports earnings on 4/29/10 BMO.

BPOP Bull Flag, Pennant Type Consolidation

I have owned BPOP jul $3.00 Call options for quite a while now along with some of you guys who took this trade with me. I followed the Whales on this and it has been paying us off beautifully. We have shaved some profits and will continue to do so. I am just pointing it out at this time, not to front run it, but to bring awareness to the chart. There has been continued accumulation in this names call options for quite a while now. Keep an eye on the chart as it has retraced 100% of last summers highs and continues to extend. We can see massive volume in early April after it broke an area of resistance at the end of March as depicted by the light blue line. At that time you can notice the volume started to pick up and then absolutely exploded. Now this stock appears to be resting via a pennant type or bull flag consolidation on lighter volume. Keep an eye for continued upside in this name. Watch the Volume for confirmation and conviction.

Next Targets

127% Fibonacci extension = $4.27
A/B Measured Move, the Flag Pole = $5.20
161.8% Fibonacci extension = 5.29

Sunday, April 25, 2010

CTB update

I still own CTB with an avg price of 21.80. I currently have my stops set @ 19.20.
You can see there is a Cup and Handle type formation and a couple of inverse H&S as depicted by the white ovals. Look at the increase in volume on the push higher and now we are seeing a decrease in volume as it consolidates via a bull flag type. I am looking for this thing to push the Cups measured move of $5.00 which gives me an ultimate target of $26ish.

My targets are as follows,

The 127% Fibonacci extension = $22.37
The 161.8% Fibonacci extension = $24.04
Cup and Handles Measured Move = $26.00ish

If the position starts pushing up I will trail my stops accordingly

LUK pulls back to previous resistance

Taking a look at LUK, you can see that it is pulling back to previous resistance which seems to be acting as support. I am not trying to front run these things and full disclosure,I own the jun 30 calls which I entered @ .30 as a starter position in case it pulled back to previous resistance, which it has and looks to have made it new support via a bottoming tale hammer. Now I am looking to add here @ .15 to 20 to lower my cost. I had A stop @ .05 which I will move up if the position starts to work.

ATPG

I continue to be a Cautious Bull in the markets and especially in the Energy and Transport space. This week I will be focusing on Gold and Energy stocks. I will be away but I have me orders set.

Here is another good looking chart.

ATPG

Nice push up on increased volume and now consolidation via a bull flag and decreasing volume. Keep an eye on this as it might get a push up and give us the A-B measured move via a C-D extension to the $27.50ish area. Also note the volume as it is increasing.

A few more Gold names to keep an eye on


SA


RGLD


NEM


KGC


IAG


GOLD


GFI


EGO


AUY


ABX


AEM

CDE is also Looking Attractive


CDE is in the Silver and Gold space and should benefit as well with a push in Gold. Technically this chart is set up very nicely. We can see that CDE is trying to break away from the downward trend it had been in for a couple of months. It looks to have formed a base and is now trying to get going. It does have some work to do with a couple of areas of resistance depicted by the Light Blue lines. The second light blue line identified by the letter B also coincides with the 38.2% Fibonacci Retracement,the 200 SMA, and the Left Shoulder. If that area can get taken out I can see CDE push to the NL Measured Move around $21 which is right by the 61.8% Fibonacci Retracement area and possibly attempt a full 100% Retracement. We are also starting to see volume generally accumulate as of late on the up days, so keep an eye on volume for confirmation of the move as well, it can show conviction.

If this stock can clear the the first light blue line depicted A, I will put on a starter position with an initial stop below the lows of 4/19/10 @ 15.75. I will look to add to the position if it makes it through the second light blue line depicted by letter B which also comes in at the 38.2% Fibonacci Retracement, the 200 SMA, and also the Left shoulder area.

If my thesis is correct I will trail my stops up as the position starts moving the way I think it can

NL = Neck Line
L = Left Shoulder
H = Head
R = Right Shoulder

Initial Risk = roughly !.25
Possible reward $4.00 to $8.00, the latter being if we retrace the full 100% of course

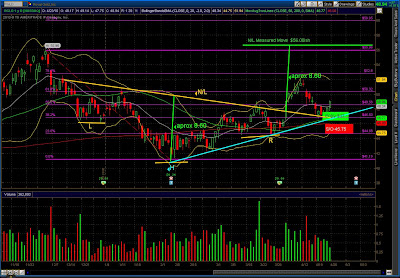
Taking a look at GG for a possible long trade


I like GG here because it seems to be mirroring the Gold Futures (/GC) ticker on TOS. You can see in the chart it also is very close to the 61.8% Retracement from the December highs and has and Inverted Head & Shoulders as well. Lately it is putting in an Ascending Triangle making higher lows. The Inverse H&S is roughly 9 pts. from the neckline to the head. The breakout occurred and failed momentarily but it looks to be finding legs again. We can see that from the Right Shoulder Push marked by letter A ( which is also known as an AB leg) it then consolidated via a bull flag depicted by the White lines ( also known as a BC leg). Now I will look for a measured move as depicted by the Green B line (also known as the CD Extension) which also brings the price action up to aprox. the 78% Fibo Retracement. I am looking to enter this position @ $41.00 with an initial stop at $38.00 for now.

If my thesis is correct, we can see this name possibly retrace the full 100% from the December highs which will come in at $46.24 followed by the full measured move depicted by the inverse H&S at about the $48ish area.

My targets if the position triggers.

Fibonacci 78% Retracement = 1st Target $43.37
Fibonacci 100% Retracement = 2nd Target $46.24
Inverse H&S Measured Move = 3rd Target $48ish
Fibonacci 127% Extension = 4th Target $49.86

Stop out will be set @ $38 initially if the trade triggers

Risk = $3.00
Possible reward = $8.00 to $9.00

I will also trail the stops up as the position becomes profitable.

NL = Neck Line
L = Left Shoulder
H = Head
R = Right Shoulder

/GC Fibonacci Study


Looking at the Gold futures we can see that after pushing through the neckline mentioned on the Inverse H&S chart and also seen here, 1,170.7 was printed as a high on 4/12/10. Gold retreated partly due to the strengthening Dollar when the Greece news hit.

Taking a look at the Fibonacci study here we can see some levels to aim for and use as a guide. We can see that Gold looks to be finding some support and getting a Bid here. I would anticipate 1,170.7 to be the first level of some pause or resistance if Gold does get going higher here. If the highs put in on 4/12/10 of 1,170.7 get taken out, look for 1193 to be an area Gold can accelerate to which comes in at the 127% Fibonacci extension followed by the 161.8% extension of 1,223.8 which comes very close to the all time highs printed on 12/03/09 of 1,227.5. I am also looking at the measured move depicted by the Green line marked A when super imposed and depicted by the Green line marked B to push Gold up to roughly the same area as the 161.8 Fibonacci extension.

I like this particular setup because it sets up several probabilities in the favor of a bullish outlook on Gold.

Keep in mind if This can fail and if Gold pulls back and puts in lower lows, we will have to go back to the drawing book to construct a new plan.

The safest and most conservative approach to enter a long position would more than likely be to wait until the April 12th highs of 1,170.7 highs get taken out.

In closing I would like to say, always keep an eye on the Dollar as historically it tends to affect commodities and Gold falls under that category.

Inverse Head and Shoulders on /GC


Here is a chart of the /GC Gold Futures. I am seeing an inverse H&S formation.

L= left shoulder
H= Head
R= right shoulder
NL= neck line

There is roughly 110 points worth if we do see a measured move.

Outlook on Gold

Hey guys here is a video of my out look on gold. I will try to get some more information out with the specific stocks I am setting buy stop bracket orders on before I leave for the week.

I will also try to get more information out on some Energy stocks I am stalking as my bias remains bullish in the Energy sector.

Here is a link to the video,

http://www.screencast.com/t/NmY1NDg4

Thursday, April 22, 2010

Possibly a good area to go Bottom Feeding on MOS or just stalking it for a Break Down


MOS looks to be at a low risk entry here. This $53 area acted as resistance from roughly mid May of 2009 until it finally gave way in November of 2009. That area since then has acted as support when the market pulled back in January of 2010 and put in a bottom in February as outlined by the magenta circle, it pushed back up and now found its way back to that previous resistance area which has acted as support once before. It is also right at the 200 MA. This offers a great entry with low risk to reward as you will know in short order if you are wrong or not. The stop can be placed in the area outlined by the red rectangle or however you see fit depending on your risk appetite. Now if it gets moving up, it can find some challenges pushing through as it has several obstacles to overcome, including a down trend line depicted by the dotted green line, the 50 MA, and eager sellers in the I want my money back camp.

One can also argue and say there is a Head & Shoulders pattern in place as depicted by the light blue ovals and take a bearish bias. From the Head to the Neckline we are looking at roughly 14 points, so if Agriculture stocks continue to weaken and the market decides to pull back some this might be one to watch for a break of the Neckline. If this support area does give way, you can look to short this name with the first target and possible area of support coming in at the $44.25 area as depicted by the orange ovals and if that gives way, a complete measured move down to the $38.80ish area which is depicted as an area of support by the white oval.

I personally am not shorting this market at the time, but thought I would share an interesting perspective that can be taken from both sides with limited risk.

TCK nice looking setup


TCK is giving us a real nice entry here with risk defined. Previous resistance put in on the January highs and March highs finally gave way when the stock broke out late March. This stock has been trading in a nice upward channel and has now pulled back to previous resistance area which now looks to be acting as support, also the bottom of the uptrend channel offers support along with the 50 day moving average. With that being said I have added a position in this name today with a stop set at $40 for now. I will look for a push to $46.50 and then $50 to $52, market participating of course. This company is based in Vancouver, BC and is engaged in mining, exploration, development, processing, smelting and refining. Its major products are metallurgical coal, copper and zinc. The Company also produces precious metals, lead, molybdenum, electrical power, fertilizers and various specialty metals. Metal products are sold as refined metals or concentrates. It also owns an interest in certain oil sands leases, and has a partnership interest in an oil sands development project. TCK is involved in copper, coal, zinc, and energy. I also like the fact that China has around 17% interest in TCK.

NUS Nice Push Higher


NUS is seeing a nice push higher after breaking resistance on 4/14. It the consolidated via a bull flag back to previous resistance which acted as support and now seeing a continued push with bullish confirmation as depicted here. Notice the Volume increase as well.

Seeing Modest Bullish Action on BHI

It looks like 1,249 contracts were purchased via a Jul 50/55 Call Spread. Looks like the 50 calls were purchased at about 3.70 while the 55 calls were sold @ 1.60. A net debit of 2.10. The max risk here is the 2.10 premium paid for the spread. Break even would come in at $52.10 while the investor stands to make a max reward of 2.90 if the stock were to close above $55.00 at expiration.

Trade

BHI jul 50 call purchased @ 3.70
BHI jul 55 call sold @ 1.60
Premium paid 2.10
Max risk 2.10
Max reward 2.90
Break even 52.10

Wednesday, April 21, 2010

Bullish Activity on CTB Indicated in the Options Market


I noticed some bullish activity this Morning on Cooper Tire and Rubber Co. CTB. At 10:45 am one investor put on a trade via a 1x2 Risk Reversal. The investor bought 7,000 jun 22.50 calls @ $0.65 and sold 3,500 jun 20 puts at $1.05 to partially finance his purchase. This is a very bullish bet. The individual is selling jun 20 puts to bring in some premium to help finance his or her bullish bias. The max risk to the downside theoretically is if the price of the underlying stock falls to 0.00 minus the credit received. The reward is unlimited and the cost is reduced by selling the put position to collect a credit. The investor is in a position to make money if the stock Rallies to close above $22.75 at expiration.

This Transaction.

CTB jun 22.50 Call bought at .65 x 7,000 = $455,000 debit
CTB jun 20.00 Put sold at 1.05 x 3,500 = $367,500 credit

If the stock does not move the the investor can loose $87,500
If the Stock closes below 20 the investor takes on the obligation of being Put the stock @ 20 on the 3,500 contracts or 350,000 shares
Max profit theoretically is unlimited
I am not sure if this transaction is attached to stock.

This stock normally trades about 1 million shares per day, today it saw almost 2.5 million shares traded on a break of resistance as viewed by the daily chart.

CTB is scheduled to report earnings on 5/04/10

I added a small position via some common @ 21.80 and will look to add more if the stock pulls back to previous resistance and it acts as new support

Tuesday, April 20, 2010

Bullish Call on OXY via a May 90 Call Option

Hey guys, I just picked up some OXY May 90 call options. I am looking for this stock to get a continued push after pulling back to previous resistance which now looks to be acting as support. I am looking for this to also get a little push into earnings. I will exit the trade prior to earnings which is scheduled to come in on April 28, 2010. Here is a link to the video.

http://www.screencast.com/t/ZGZkZjMyOD

Trade well,
PeteV

Saturday, April 17, 2010

Welcome to my Blog

I would like to take this opportunity to welcome everyone to my Blog. This Blog will consist of several videos and thoughts throughout the week and weekend updates including stocks to watch. I will post several times a week. The posts will generally consist of market sentiment and outlook with actual trades I am in and Trades I look to get in to. These posts are not recommendations and should not be taken as such. Always do your due diligence and research if you so choose to follow any of the trades I take. Please understand there are risks in trading equities, options, futures, and currencies. These risks can sometimes be larger than your initial investment, so always keep that in mind and never invest monies you can not afford to loose. I will keep updating this blog and ultimately it will be complete with things such as recommended sites, reading material and other tools I find can be both educational and useful to ones trading. Your thoughts and ideas are always welcomed. Thank you very much for your time and I look forward to posting.